
In today's digital era, seamless system management and monitoring have become essential. Building on our previous guide on remote management of TrueNAS CORE machines, this article focuses on integrating TrueNAS CORE statistics and messages into Home Assistant. This integration leverages the TrueNAS CORE API, enabling you to monitor your system effortlessly.
Contents
Importing Data from TrueNAS CORE to Home Assistant Dashboard
The TrueNAS CORE modern dashboard is a comprehensive visual tool for monitoring critical system data. However, for those who rely on the Home Assistant Dashboard as their primary interface, integrating TrueNAS CORE data directly into Home Assistant enhances accessibility and convenience. This guide will show you how to set up a sensor in Home Assistant to display essential TrueNAS CORE information, facilitating notifications or alerts about your system's status.
Utilizing TrueNAS CORE RESTful Sensors for Integration
To integrate TrueNAS CORE data into Home Assistant, we'll use RESTful sensors. A RESTful sensor in Home Assistant is a type of sensor that extracts information from an external source using REST (Representational State Transfer) API calls. REST is an architectural style for designing networked applications, and it relies on a stateless, client-server, cacheable communications protocol — typically HTTP. In the context of Home Assistant, a RESTful sensor can query external APIs to fetch data and then represent this data as state information within the Home Assistant ecosystem.
The RESTful sensor configuration allows Home Assistant to periodically make requests to an external endpoint (URL), process the returned data (usually in JSON or XML format), and display this data as attributes of the sensor. This capability is particularly useful for integrating a wide range of internet services and external devices into your Home Assistant setup, enabling you to monitor and interact with these services directly from your Home Assistant Dashboard.
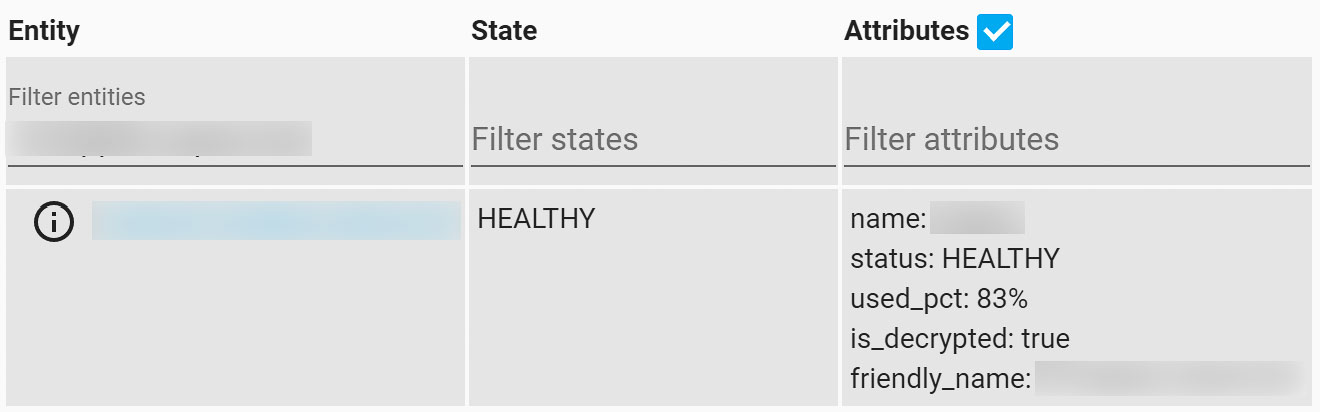
This approach does not require any RESTful commands for system actions. Instead, it focuses on fetching specific variables for monitoring. You can customize which variables to monitor by adjusting the json_attributesin the configuration example provided below:
- status: The current status of the volume.
- vol_guid: The volume’s Globally Unique Identifier.
- name: The volume’s name.
- used_pct: The percentage of used storage.
- used_si: The actual used storage space.
- is_decrypted: Indicates if the volume is decrypted.
- avail_si: Available storage space.
- total_si: Total storage capacity of the volume.
Here's an example configuration to enable these variables in Home Assistant:
sensor:
  - platform: rest
    name: freenas_report_full
    json_attributes:
      - name
      - status
      - used_pct
      - is_decrypted
    resource: http://IP-OF-YOUR-FREENAS/api/v1.0/storage/volume/VOLUME-NAME/?format=json
    value_template: '{{ value_json.status }}'
    username: !secret freenas_user
    password: !secret freenas_password
    authentication: basic
    headers:
      Content-Type: application/json
As highlighted in our previous guide, the secrets.yaml file is used for secure credential storage.

Creating Template Sensors for Detailed Monitoring
The initial setup provides a consolidated entity with various attributes, but it may not be practical for direct display or use in automations within Home Assistant. To display individual data points or use them in automations, create a template sensor for each attribute.
Monitoring Percent Used
For those interested in tracking how much storage is being used, the following configuration creates a sensor that displays the percentage of used storage on your TrueNAS CORE system:
sensor:
  - platform: template
    sensors:
      freenas_percent_used:
        entity_id: sensor.freenas_report_full
        friendly_name: "Percent Used"
        value_template: "{{ states.sensor.freenas_report_full.attributes['used_pct'] }}"
Volume status
To keep an eye on the health and status of your storage volume, use the configuration below. It creates a sensor that reflects the current status of your TrueNAS CORE volume, such as online, offline, or degraded:
sensor:
  - platform: template
    sensors:
      freenas_status:
        entity_id: sensor.freenas_report_full
        friendly_name: "Status"
        value_template: "{{ states.sensor.freenas_report_full.attributes['status'] }}"
TrueNAS CORE Version Details
For comprehensive system version tracking, including both the full version string and the specific version number, use the following configurations:
Full Version:
This configuration fetches the full version information of your TrueNAS CORE system, including the build number and release details:
sensor:
  - platform: rest
    name: fn_version_full
    json_attributes:
      - fullversion
      - name
      - version
    resource: http://192.168.1.10/api/v1.0/system/version/?format=json
    value_template: "{{ value_json.fullversion }}"
    authentication: basic
    headers:
      Content-Type: application/json
    username: !secret fn_user
    password: !secret fn_password
    scan_interval: 3600
Version Number Only:
For a simplified view that only shows the version number of your TrueNAS CORE, the following template sensor configuration is ideal:
sensor:
  - platform: template
    sensors:
      fn_version:
        entity_id: sensor.fn_version_full
        friendly_name: "Version"
        value_template: "{{ states.sensor.fn_version_full.state.split(' ')[0] }}"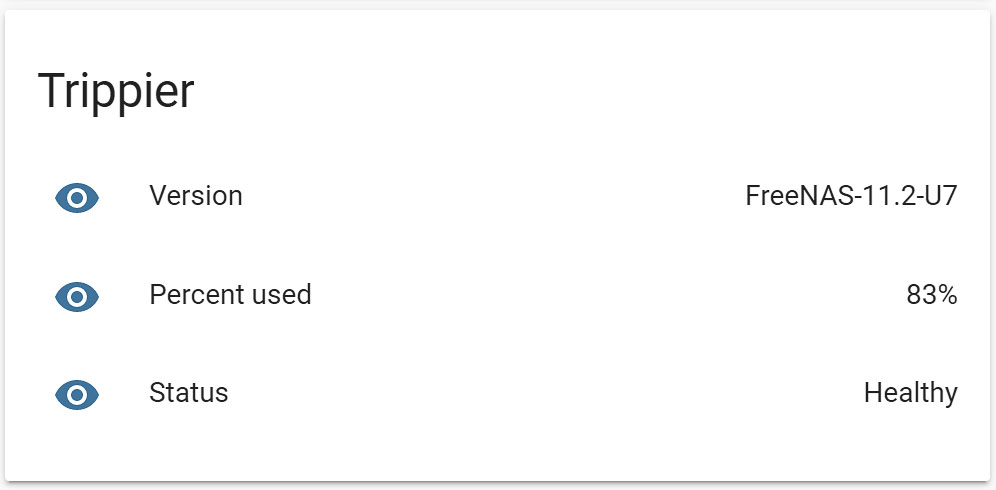
Conclusion
By integrating TrueNAS CORE statistics into your Home Assistant, you enable a powerful monitoring tool that enhances your system management experience. This setup not only provides critical insights into your TrueNAS CORE system but also offers flexibility for custom notifications and automations. Through straightforward configurations and creative use of template sensors, you can maintain oversight of your system's health and performance, ensuring your digital environment runs smoothly.

Heads up, seems you have a typo in the volume status template. Missing the sensor in “states.sensor.freenas…..”. Great blog though, love it!
Thanks for that! Have updated the post. And also thanks for your praise!